1. Introduction
In recent years, Enterprise Risk Management (ERM) has been focused on identifying and addressing both internal and external risk factors in order to ensure business continuity in competitive markets. Conversely, quantification of economic impacts has focused on measuring how risk factors affect the different components of financial statements through key risk indicators (Hjortsø, 2016). Traditionally, the economic impacts of risk factors in the profitability of the organization are measured over financial variables such as net earnings, cash flow or capital indicators, as Earnings at Risk (EaR), the Cash Flow at Risk (CFAR) and Capital at Risk (CaR), respectively, as mentioned by different authors (Albuquerque, Eichenbaum, Rebelo, & Luo, 2016). However, these impacts can be measured over different financial indicators, such as earnings before interest, taxes, depreciation and amortization (EBITDA), return on invested capital (ROIC), return on equity (ROE), return on capital employed (ROCE), among others (Copeland, Koller, & Murrin, 2000).
In the last two decades, the development and implementation of ERM systems in companies has been important in the progress of management theory (Power, 2008). Conversely, the quantification of the financial effects of external and business risk factors continues to be under development because of the great variety of possibilities. By definition, key risk indicators (KRI) try to measure the risk economic impact in a horizon of time with a probability level as an extension of the concept of Value at Risk (VaR) proposed by JPMorgan in 1994 (Power, 2008).
Traditionally, KRI indicators has two limitations. First, EaR and CFAR do not consider the future development of the value of net assets and liabilities sensitive to the external risk factors and not subject to administration management. They concentrate the analysis on company income statements. Second, CaR focuses on measuring capital adequacy to cover adverse events; however, even if it is possible to isolate the contributions of the active and passive capital positions, it leaves aside the effects of these variations considering mature and evolving positions scenarios which is a process in the medium or long term. It means there are missing elements in the traditional administration process.
Regarding the management and the value of the net assets of operation, the principle of creating value indicates that the return of used resources must exceed the cost of financing sources via liabilities and own funds (Knop, de Castro Riesco, & Fernandez, 2006; Neftci, 2008; Smithson, Smith, & Wilford, 1989), which means that the management must undertake a resources optimization process in order to achieve this goal (identifying and optimizing value drivers such as earnings growth, improving operating margins, finding more efficient use of assets and strengthening management). In turn, the value of available resources or assets are sensitive to changes in certain factors such as the discount rate, the projection parameters and market conditions, which in some cases escape administrative control. Consequently, one of the principal objectives of this research is to provide tools in order to maintain the equity value that means compliance of the financial goal.
From an accounting approach, historical data can represent the balance between assets and sources of funding (liabilities and equity) (Narayana & Mahadeva, 2016). However, from a financial point of view, there is a temporal imbalance between the times when the investments are made and the period when the financial obligations are engaged. This leads to a loss of value over time and net assets deterioration. Hence, the importance of equally recognizing of risks arising both from the balance sheet and the income statement as Copeland et al. (2000) and Dumrauf (2013) signaled.
While financial theory has made significant progress in asset management, there are still concerns associated with how to model the evolution of net assets and liabilities of the company and quantify their effects on capital (Vyadrova, 2015). This paper shows how to include in business valuations risk factors that do not depend on management, such as changes in interest rates and their impact on the social capital of the company (Duffie & Garleanu, 2001; Kanchu & Kumar, 2013). The principal objective of this paper is the inclusion of new indicators in the financial evaluation. Considering the theory and new research, we propose new tools for measuring the risk, from financial innovation. Additionally, the results derivative from the research considers the applications in a real company applying the methodology of case study, in order to test the built model.
Methodologically speaking, we are using the mix of quantification between fixed income risk and considerations from corporate finance methods, which makes it a hybrid applied in corporate portfolios. This paper is structured as follows. In the first section a classical risk management approach is presented where we consider the levels in the balance structure, and briefly define the theoretical concepts applied in corporate portfolios, even depicting the existing of asymmetries between market portfolios and corporate assets. The second section is dedicated to the model proposal and the new contribution. The third section considers the application of the model in a real scenario using information from an energy trader. Finally, the last section presents the conclusions and future proposal works.
2. Theoretical framework
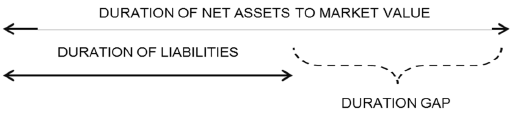
In financial institutions, Management of Assets and Liabilities (MAL) (figure 1) serves to control and balance the deposits and loans of the bank. This process is known as immunization of portfolios (Bierwag, 1987), where it uses different strategies framed into the concept of duration and convexity (Beck, Goldreyer, & D'Antonio, 2000; Bierwag & Kaufman, 1985). In this process, the affected positions by changes in interest rates are identified, and ongoing monitoring is done by integrating all areas or lines of business, meaning loan portfolio, commercial lines, mortgage, consumer, small and medium enterprises, corporate and so on. But the problem is that there are no applications in companies different from banks.
Furthermore, acquisitions are considered sources associated with the issuance of securities, short-term loans, reserve, savings accounts, checking accounts, deposits, among others (Martinez Abascal & Guasch Ruiz, 2002). The review of both active and passive positions is consolidated in operational terms. It is then aligned based on the risk profile that the financial institution wants to assume. Nevertheless, in many institutions, risk management tasks sometimes deviate from this goal by concentrating their efforts on quantifying other menaces as the risks of credit or market, disregarding risk tolerance factors and alignment of positions action plans of the institution as Grable (2000) described in his research. That is why we are probing the possibility of improving the measures of corporate risk, because the advances have focused on the financial sector.
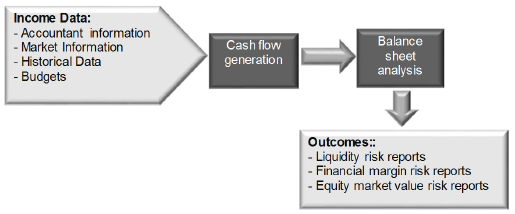
Source: own elaboration
Figure 1 Management of assets and liabilities process.
The market risk losses can be quantified in function of the change of interest rates by applying the VaR models (Jorion, 1991; Knop et al., 2006). When this concept is applied to the entity as a whole, the financial statements include the exposure risk measures associated with earnings, EBITDA, cash flow or capital of the company (Neftci, 2008), but usually the balance sheet is not considered as a financial statement. Moreover, the only indicator related to the balance sheet is the CaR: it is an aggregate solvency metric regarding different risk factors. Although this measure allows to quantify the changes in the value of the asset and liability positions affected by various risk factors (including interest rates), this does not address the active management temporal dimension of the structure instalment of the entity's assets and liabilities, and its maintenance and evolution over time.
From another perspective of risk analysis, the financial sector has made significant progress in managing and quantifying the exposure to market risks, credit and operational risk, driven by the Basel accords (Blundell Wignall & Atkinson, 2010). Thanks to these agreements made by the financial sector in the developed countries, the theoretical contributions related to management and risk quantification have been promoted and implemented in many countries looking for a solid financial sector facing changing market conditions (Qingle & Jie, 2001). In many countries, the financial sector regulator is aligned with all these norms; however, the application of these systems in enterprises in other sectors is still an incipient process, which puts at risk the sustainability and competitiveness of companies in open market environments.
The following subsections present an analysis of risk measurements in financial institutions, the basic measurement concepts for fixed income assets and the symmetry with corporate portfolios.
2.1. Risk analysis levels in the balance structure - financial statements
Risk analysis concentrated on the balance sheet and the evolution of the market value of equity has been treated classically under a static perspective. It focuses usually on the variability that comes from the income statement and considered the financial statement as reflecting the context of the company for a certain period, as United States Patent Application No. 10/387,412 and Power (2008) mentioned. However, the review of the risk structure from a dynamic perspective could establish an active management of the institution's positions.
That can be achieved by observing elements such as investment policy, credit policy and financing as well as monitoring risk factors such as interest rates changes (Hjortsø, 2016). The following levels can be stated in the risk analysis on the maturity structure of the asset and liability positions of the entity. They may be staggered in order to help the financial manager in control processes; the levels were described by Beck et al. (2000) :
Level 1: a review of the gaps between available resources to generate operating profits and the funding source. The analysis includes the structure of assets and liabilities (excluding equity). The aim is to identify the degree of exposure to the movement of interest rates of those balance sheet items that are sensitive to changes.
Level 2: incorporates measures of variability such as duration, modified duration, duration of Fisher-Weil and convexity. Simulating scenarios for output flows and subsequent representation in the evolution of equity through CaR measures.
Level 3: considers Monte Carlo simulations on the flows projection and scenarios that incorporate the financial plan both medium and long term. Models for calculating the volatility and probability distributions can be implemented as well. This process will allow to measure how the factors impact a company's valuation.
Level 4: an analysis of the relationship between risk and return. It allows to include measures that turn into optimizing resources balance, debt capacity, return on invested capital and consolidation strategies.
We propose an approach based on the concepts derived from the management of assets and liabilities in financial institutions. We apply them to the management analysis of the term structure of passive and active positions in companies of any sector.
2.2. Duration, convexity and immunization
The calculation of risk indicators associated with investment portfolios is an integral part of any portfolio management. It includes fixed income, equities, stocks, currencies, among others (Fabozzi & Mann, 2012). Overall, the fixed income portfolios have significant impact within the range of possibilities that enterprises manage. This is because of the lower risk perception they have on investors. They are classified under the plain vanilla or amortization bullet or at maturity (Fabozzi & Modigliani, 2003). For these instruments, it is possible to link the variability of the value of bonds to changes in the factors that determine the price, such as interest rates or term to maturity; making it possible to monitor the degree of exposure of the portfolio.
The following subsections consider the description of elements from fixed income analysis that will be applied in corporate portfolios.
2.2.1. Duration
The concept of duration is a risk indicator that measures the variation in the bond price related to changes in interest rates. It is defined as a weighted average of the different maturities of coupons of a bond, taking as weights the relative importance of each flow regarding the valuation factor (Fabozzi & Mann, 2012; Armeanu, Balu, & Obreja, 2008). The duration of a fixed income security is not the time of expiration, and is less than it.
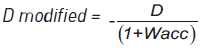
2.2.2. Modified duration
It is understood as the measure of direct impact on bond prices caused by variations in rates. Mathematically understood as the first derivative of the price with respect to the interest rate of return (IRR) (Fabozzi & Modigliani, 2003).
2.2.3. Convexity
The convexity is a property of the debt instruments used when changes in interest rates are very large. It is considered when the duration of the bond is not enough to quantify potential changes in the value of the security resulting from interest rate changes. In these cases, it is necessary to add the convexity effect to the calculated change by duration in order to adjust the title's value. Assuming that the relationship between rates and the present value of a bond is inverse, the duration states that this relationship is linear. However, the concept of convexity goes further, representing a convex relationship from the second partial derivative of the bond value regarding its IRR (Fabozzi & Modigliani, 2003; Duan, Moreau, & Sealey, 1995).
2.2.4. Immunization
This principle of hedging a portfolio of fixed income assets is based on the concept of duration and is associated with a passive portfolio management (buy and hold) to ensure a stream of future payments. If the duration between the active and passive positions of an institution is significantly different, the price increases thanks to a fall in interest rates and will be more significant for last longer positions (i.e. loans portfolio and deposits in a bank). The purpose is that the duration of the portfolio corresponds to the duration of payments in the future according to Fabozzi and Mann (2012) and Bierwag, Kaufman and Toevs (1983).
2.3. Symmetry between rating bonds and companies
A company and its set of assets may resemble a portfolio of securities with different yields, maturities and characteristics. From this approach, it is possible to apply the strategies used in managing the portfolio of securities to the management of all assets and financing sources (Duffie & Garleanu, 2001).
For example, from the vertical analysis of asset accounts balance (which lets us see the composition of investments used in the operation) in parallel with the analysis of the capital structure of the company (to analyze the composition of the financing sources), it would be relatively easy to obtain an empirical approach to the weights assigned to positions that make up a portfolio, according to Fernandez (2008). Then it would be possible to obtain theoretically the efficient frontier of the company's structure from the Markowitz perspective (Bodie, Kein, & Marcus, 2002).
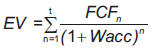
In turn, net operating assets are financed through debt or equity. Those are different from spontaneous funding and have an explicit cost (Piterbarg, 2006). Then we start from the projections that reflect the functionality of the assets involved for a well-defined time horizon according to the particular business situation. The relevant period of maturity of an on-going business is not a matter of chance; it is necessary to define rigorously the financial perspective extent. Subsequently, the value of continuity that collects the flows associated with the business perpetuity period is calculated (Fernandez, 2008). This is done via residual value multiple. Finally, the enterprise value (EV) is found by discounting the net free cash flows using the rate of cost of capital (weighted average cost of capital - WACC).
At this point, it is possible to compare concepts. For the purpose of this paper, we assume that free cash flows resemble a bond whose coupon is variable. If there are stages of high investments when flows could become negative; the weighting of the coupons is diluted (Hull, Treepongkaruna, Colwell, Heaney, & Pitt, 2013). The projection period is similar to the term of maturity of the bond. The residual value or continuity corresponds to recognized face value of the bond at maturity. Finally, the WACC is a representation of bond yield to maturity (YTM). The forecast exercise in a company can be classified as a plain vanilla or bullet if an unlimited life business is recognized, it means if we consider a perpetual value.
3. Developed model
Equity is sensitive to changes in interest rates since the assets at market value (enterprise value) and liabilities (debt) are sensitive to movements in interest rates (Albuquerque et al., 2016). In the equation 1 we present the relationship.
 (1)
(1)
Where Kd is the costs of training debt; Wacc is the Weighted Average Cost of Capital; E (Wacc,Kd) is the market value of equity and WACC is a function of Kd; EV(Wacc) is the market value of the company and the present value of the cash flows generated by operating discounted at WACC; D(Kd) is the market value of debt discounted at cost debt Kd.
Thus, the mathematical development of fixed income instruments may be adapted to the corporate business risk management purposes. In this way, Fabozzi and Modigliani (2003) described the equations, as follows:
 (2)
(2)
Then the duration (D) is the first derivative:
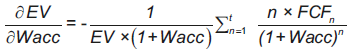 (3)
(3)
It means,
 (4)
(4)
Including convexity,
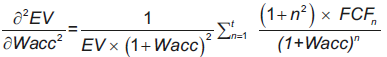 (5)
(5)
Where D is the duration; EV is the enterprise value and FCF is the free cash flow.
Like any assets exposed to market forces, interest rates are determined due to the interaction between supply and money demand. They are subject to evolutionary volumes according to the preferences of the actors in the economy and therefore the levels of risk aversion. Phenomena such as economic downturns or recessions, current account deficits, developments in emerging and developing countries, inflation expectations, and so on, cause a movement in the perception of systemic risk (Manco, Botero, & Medina, 2016) that results in rate changes (Saunders, Cornett, & McGraw, 2006).
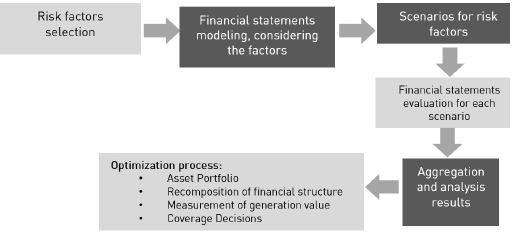
For the valuation of any financial asset, interest rates represent a parameter of great importance, as well as other risk factors such as exchange rates, inflation, the cost of raw materials, rate of return, rate differentials (spreads), curves, among others (Stone, 1974), which need to be considered in the analysis. In figure 2 the process of optimizing the corporate portfolio is presented by Bodie et al (2002) .
Source: own elaboration
Figure 2 Optimization process through modeling.
This risk measurement model focuses on the balance sheet and provides an approximation of the exposure of the market value of equity (equity value) against movements in the discount rate (WACC). The market value is defined as the difference between the enterprise value (EV), that are net assets, and the value of interest-bearing liabilities (debt), both in current equivalence according to Copeland et al. (2000).
If the forecast horizon to calculate the company value is large, then the duration calculated on the value also will be. Therefore, the company might be very exposed to changes in the rate. The duration gap is then the difference between the duration of the company at market value and the duration of the debt. The process to find the duration's gap consists of 3 steps (Augustin, Sraer, & Thesmar, 2013; Beck et al., 2000):
Establish the cash flows associated with the assets and debt. This refers to the free cash flow and cash flow borrowing from a financial perspective exercise performed on the projection horizon.
Calculate the duration of the portfolio of net assets and financial liabilities using the first derivative of the price to the discount rate (Fabozzi & Modigliani, 2003).
Duration gap - for this research, it is the result of the difference between the duration of net assets - DNA - (enterprise value) and duration of financial liabilities with cost (DL). The latter is adjusted by the ratio of the market value of debt (PV) and the market value of the assets (EV). This allows to recognize the proportion of assets financed with equity, which are not sensitive to changes in interest rates.
Then, we defined the new equations in order to apply the market theory in corporate portfolio management, specifically enterprises valuation and exposition to interest rates, the new equations are:
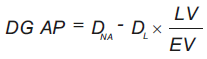 (6)
(6)
Where LV is the market value of debt, liabilities value; EV is the enterprise value; D NA is the duration of net assets; D L is the duration of liabilities.
Similarly, the change in the value of assets as a result of rate movements will resemble the accounting relationship:
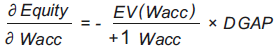 (7)
(7)
The relationship between risk measurement of the net market value and debt assets generates a conclusion briefly treated in the classical texts. It states that corporate balance sheets are in balance from an accounting point of view (Bierwag & Kaufman, 1985). However, when reviewing the characteristics of the investment versus the characteristics of funding sources, they are unbalanced (Bouchaud & Potters, 2003). In other words, financially speaking, balances are not well-adjusted in the face of sustainable value creation as shown in figure 3.
Source: own elaboration
Figure 3 Duration gap representation.
Then, major changes in rates will generate strong variations in corporate assets convexly. Table 1 indicates the effect on the market value of equity to changes in the rate, as a function of duration gap.
Table 1 Duration gap: scenarios and sensitivities.
| Duration gap | Change in interest rate | Change in equity value |
|---|---|---|
| Positive | Increase | Decrease |
| Positive | Decrease | Increase |
| Negative | Increase | Increase |
| Negative | Decrease | Decrease |
| Zero | Increase | Zero |
| Zero | Decrease | Zero |
Source: based on Beck, Goldreyer and D'Antonio (2000).
As we mentioned above for fixed income portfolios proposes (Smithson et al., 1989), immunization consists of structuring them in a way that allows assuring the manager about payments (inflows) during the investment horizon. It forces their duration to the average duration payments in the future (Lai & Hwang, 1993). Similarly, balance sheet immunization will be to ensure the payment of obligations from the returns arising from net operating assets through free cash flow. A balance will then be immunized if it has a close to zero duration gap in banks, as Beck et al. (2000) and Erb, Harvey and Viskanta (1996) mentioned, but it's possible to consider the definition in corporate portfolios.
4. Results
In order to apply the proposed methodology, we obtained financial information from an energy trading company related to a valuation process due to a mergers and acquisitions (M&A) procedure. The analysis in addition to providing the company's value, evidences a financial disparity that affects the future sustainability of the investment.
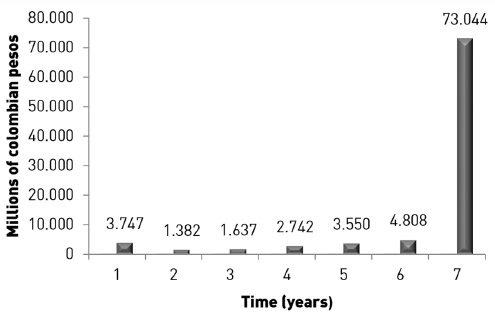
The estimations horizon was 7 years. They were supported by several assumptions: the company had depreciable fixed assets in a straight line trend for which this was the missing period, the maturity flows of similar group companies had been achieved in that period and finally marketing their product responded very closely to economic cycles, figure 4 shows the flow of net free cash obtained from the valuation process.
We can observe graphically that the projection of cash flows resembles a bond maturing in 7 years, thus being possible to calculate the duration of the net assets market responsible for the free cash flows. On the other hand, the company had cash loans maturing within one year and medium-term loans, whose maturity was about four years.
Source: own elaboration
Figure 4 Projected free cashflow - residual value multiple.
In order to probe the exposition to interest rates, we are presenting the next results, simulating different scenarios. Table 2 indicates the changes in equity value.
Table 2 Sensitivities of interest rates.
| Interest rate | Equity change |
|---|---|
| 7.8% | 25.0% |
| 8.8% | 18.1% |
| 9.8% | 0.0% |
| 10.8% | 5.6% |
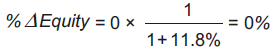
| 11.8% | 0.0% |
| 12.8% | -5.3% |
| 13.8% | -10.2% |
| 14.8% | -14.7% |
| 15.8% | -19.0% |
| 16.8% | -23.1% |
Source: own elaboration.
After the exposition is presented, we can calculate the duration gap, and it is positive: 3.5 (the difference between 6.1 assets duration - 2.6 liabilities duration), thus, it will generate a negative impact on the value of assets if an increase in interest rates materializes. Thus the level of exposure is:
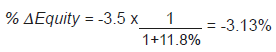
As monetary value, as follows:

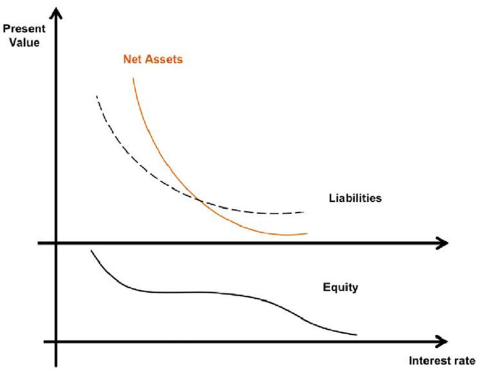
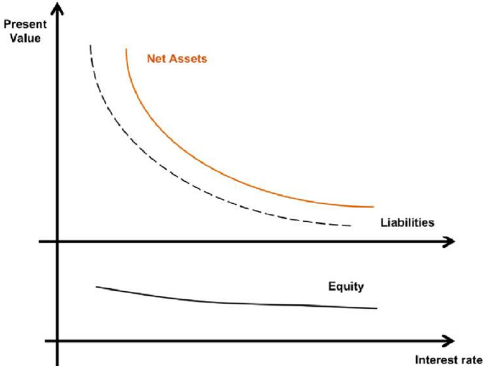
Thus, an increase of 100 basis points in the interest rate would represent a decrease of 1,420 million in the market value of the equity company. The results are conclusive, given that to improve their level of exposure the recommendation is to increase the term of their debts, i.e., renegotiate. Thus a lower duration gap partially reduce exposure. In short, traditionally the change in asset valuations has a pronounced drop due to an increase in rates because the convexity of the net assets and liabilities are very different, being more evident in assets, as shown in figure 5. It is possible to identify from figure 5, that the equity movement is variable if the convexity of assets and the convexity of obligations are different.
Source: own elaboration
Figure 5 Traditional behavior of corporate balance sheets.
Changes in Equity value are close to zero if the gap is zero, it means that the financial statement is in equilibrium and furthermore, the valuation. After the corporate portfolio is immunized, table 3 shows the changes in equity value.
Table 3 Sensitivities of interest rates - immunization.
| Interest rate | Equity change |
|---|---|
| 7.8% | 2.1% |
| 8.8% | 1.8% |
| 9.8% | 1.7% |
| 10.8% | 1.0% |
| 11.8% | 0.0% |
| 12.8% | -0.8% |
| 13.8% | -1.1% |
| 14.8% | -1.3% |
| 15.8% | -1.7% |
| 16.8% | -1.1% |
Source: own elaboration.
An immunized balance meanwhile would consider a similarity in the convexity of the net assets and liabilities, generating a low impact on the equity. It allows safeguarding the valuation of equity versus the calculation parameter set out in interest rates (figure 6). In this case, when the balance sheet is immunized, it means that the convexities are similar and the equity is stable.
Source: own elaboration
Figure 6 Immunized balance behavior.
5. Conclusions
Companies do not usually include in their value creation analysis, the degree of exposure of the market value of equity and their own value in relation to financial disparities. Those differences arise from the differential of durations between the net assets at market value and liabilities. Such a discrepancy should make an additional analysis element in their active risk management. It would allow to define their policies for asset and liability positions.
This work highlights the importance of determining the risk valuation as a measure of the impact that a change in the interest rates has on the evolution of assets and compliance with the financial objectives. This concept is not unique to financial institutions, and can also be applied in the analysis of operations of M&A, privatizations, changes in capital, share price performance, guarantees, transformations of companies, among others.
The inclusion of a new risk indicator in business value measurements, will allow the compliance of the basic financial objective, which refers to the creation of value. Immunizing corporate portfolios is an innovative management tool for company managers. In that sense, the systemic risk control that tackles the contagion effect (Manco et al., 2016), which is how changes in one element affect the others, considers the interest rate as the failure element.
Metrics based on key risk indicators (KRI) traditionally have focused on quantifying the risk based on the companies, income statement and cash flows. They apply indicators such as the VaR on profits, EBITDA, earnings before interest and taxes (EBIT), net income or costs among others. The use of the same concept into the balance sheet turns into calculating the Capital at Risk (CaR) as a measure of solvency. We proposed the use of the duration gap metric, as a complementary KRI indicator, that allows quantification and measurement of risks on equity to changes in the interest rate (companies with high gap and high volume of assets are very exposed in terms of loss of value) and its use allows to determine the balance sheet structure that minimizes negative future impacts.