ggbuildr is a simple tool for saving incremental
“builds” of a ggplot object. Intended use-case is to save plots for
presentation slides.
To install from GitHub:
# Currently only available as development version from Github
# install.packages("devtools")
devtools::install_github("jongbinjung/ggbuildr")library(ggplot2)
library(ggbuildr)
set.seed(1)
X <- rnorm(20)
Y <- X + rnorm(20)
pd <- data.frame(X, Y)
p <- ggplot(pd, aes(X, Y)) +
geom_smooth() +
geom_point(shape = 21, size = 2,
fill = "white", color = "black") +
# Fixing the limits ensure plot ranges are constant
coord_cartesian(xlim = c(-2.5, 2), ylim = c(-4, 4))
# Plot smooth, and then point
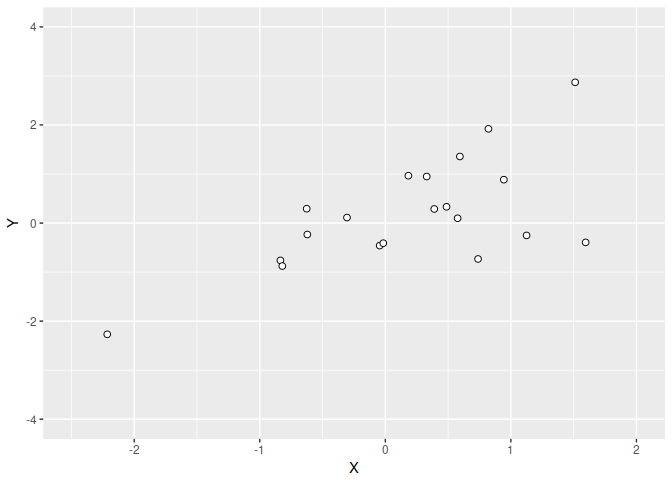
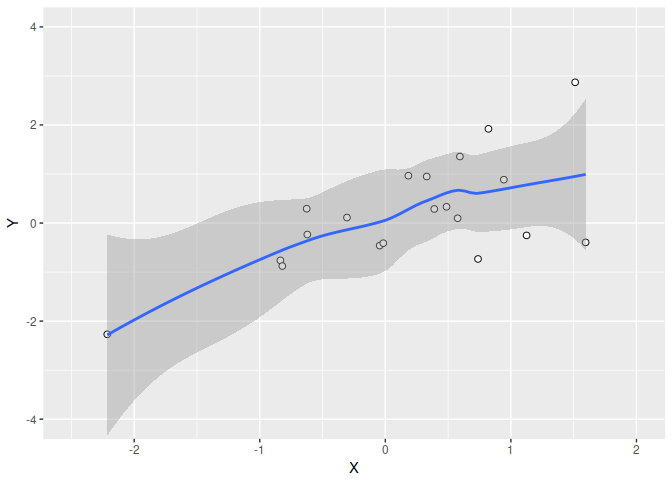
build_plot(p, build_order = list(1, 2))
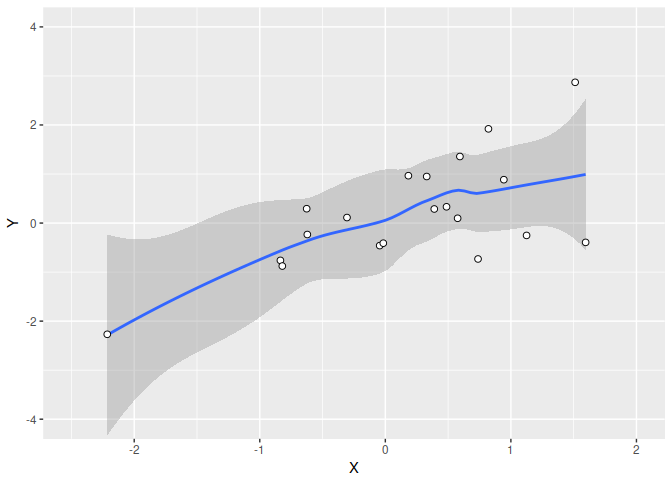
# Plot point, and then smooth, but preserve order (i.e, keep points on top)
build_plot(p, build_order = list(2, 1))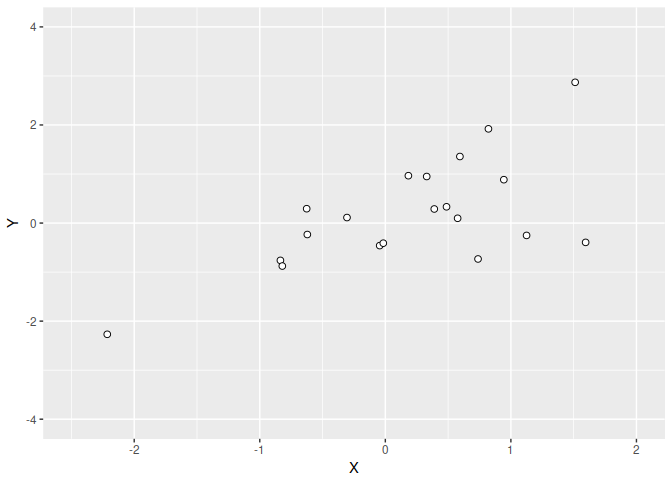
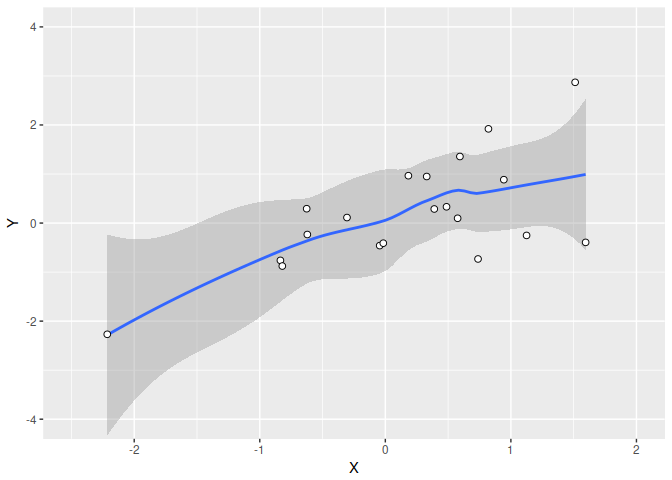
# Plot point, and then smooth, and draw smooth layer on top of point
build_plot(p, build_order = list(2, 1), preserve_order = FALSE)